A bit about me
Got my Bachelor and Master in Statistics between the Universities of Bologna, Glasgow and Melbourne

Since two months
I'm a Bioinformatics Data Scientist at the Melbourne based startup Mass Dynamics
Mass Dynamics is on a mission to free humanity and society from the burden of disease by helping more life scientists transform proteomics data to knowledge - better, faster and easier.

Since two months
I'm a Bioinformatics Data Scientist at the Melbourne based startup Mass Dynamics
Mass Dynamics is on a mission to free humanity and society from the burden of disease by helping more life scientists transform proteomics data to knowledge - better, faster and easier.
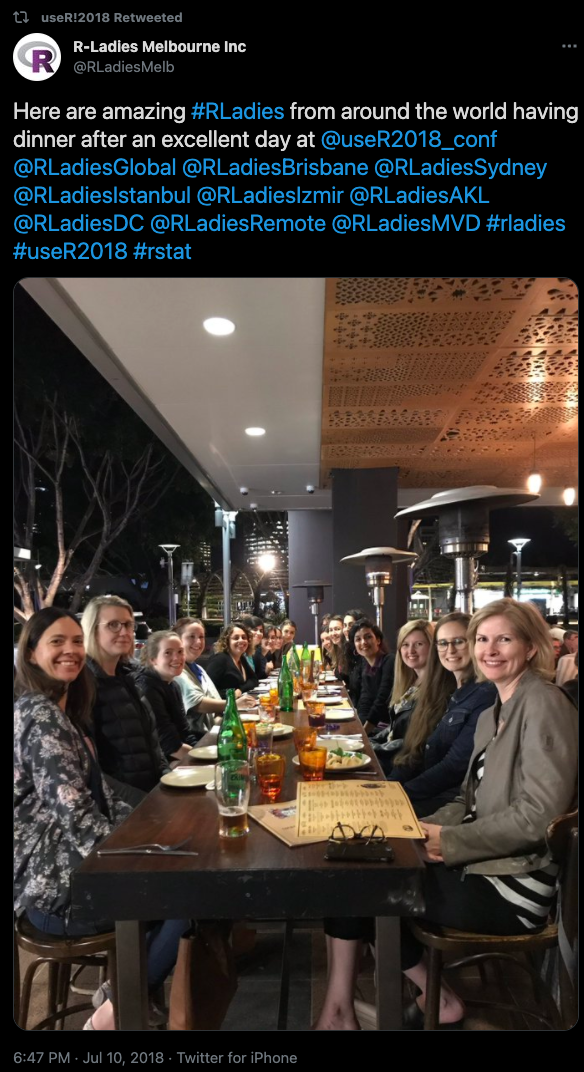
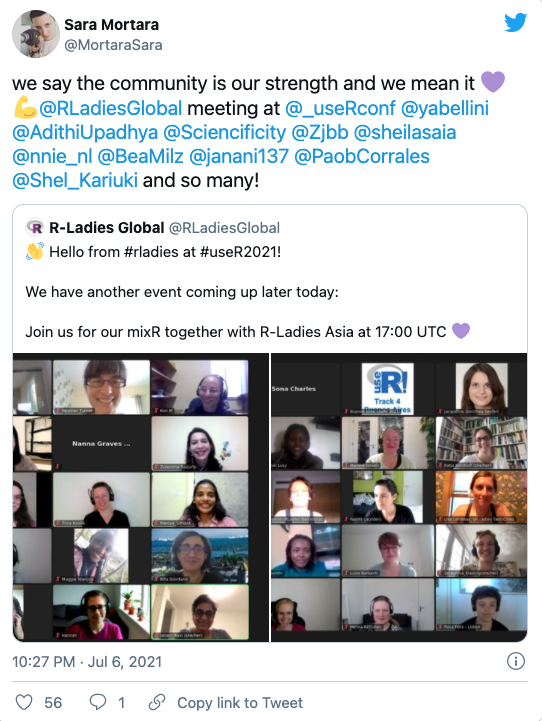
useR! is one of my favorite conferences!
R-Ladies dinner useR! 2018
R-Ladies online cathcup 2021
Disclaimer
My highlights also corresponds to talks presented in our timezone
All talks and workshops will be made available online very very soon! I'll keep you posted
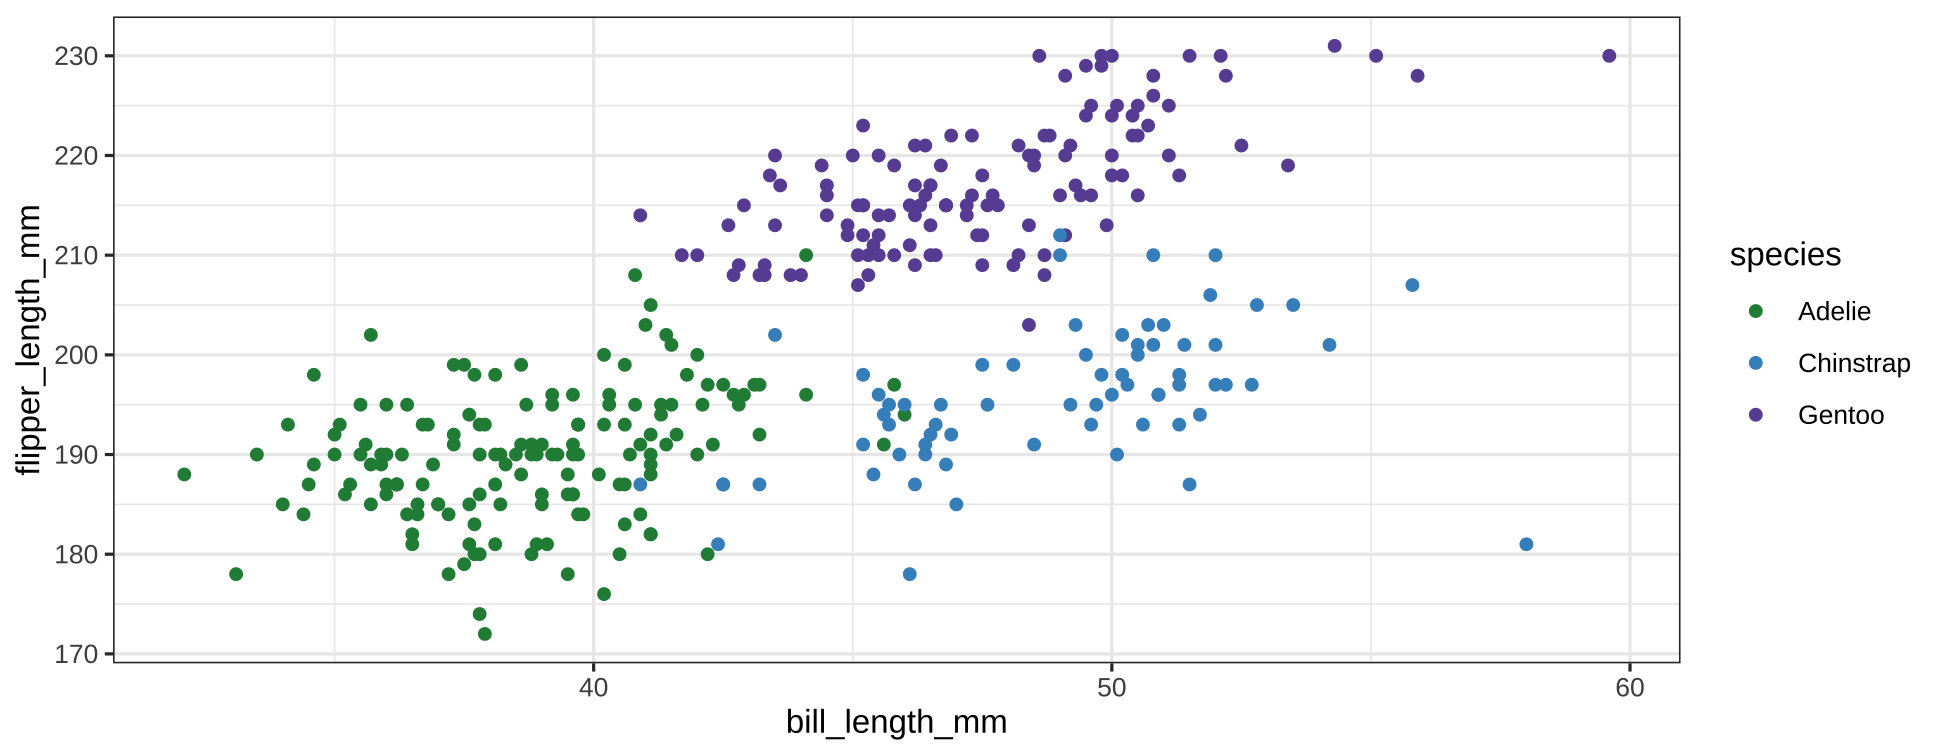
🐧 {palmerpenguins} is the new {iris} 🌷
Authors: Allison Horst, Alison Hill, Kristen Gorman
The 🔗{palmerpenguins} 📦 provides a great dataset for data exploration & visualization, as an alternative to iris.
install.packages("palmerpenguins")library(palmerpenguins)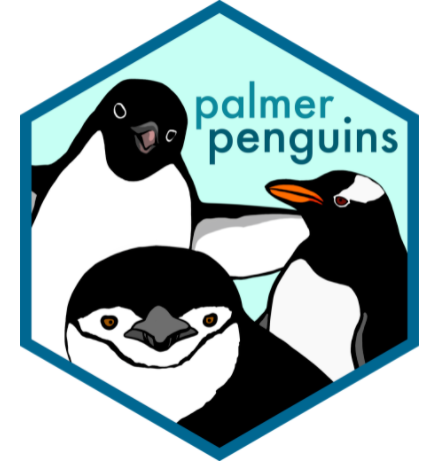
🐧 {palmerpenguins} is the new {iris} 🌷
Authors: Allison Horst, Alison Hill, Kristen Gorman
The 🔗{palmerpenguins} 📦 provides a great dataset for data exploration & visualization, as an alternative to iris.
install.packages("palmerpenguins")library(palmerpenguins)
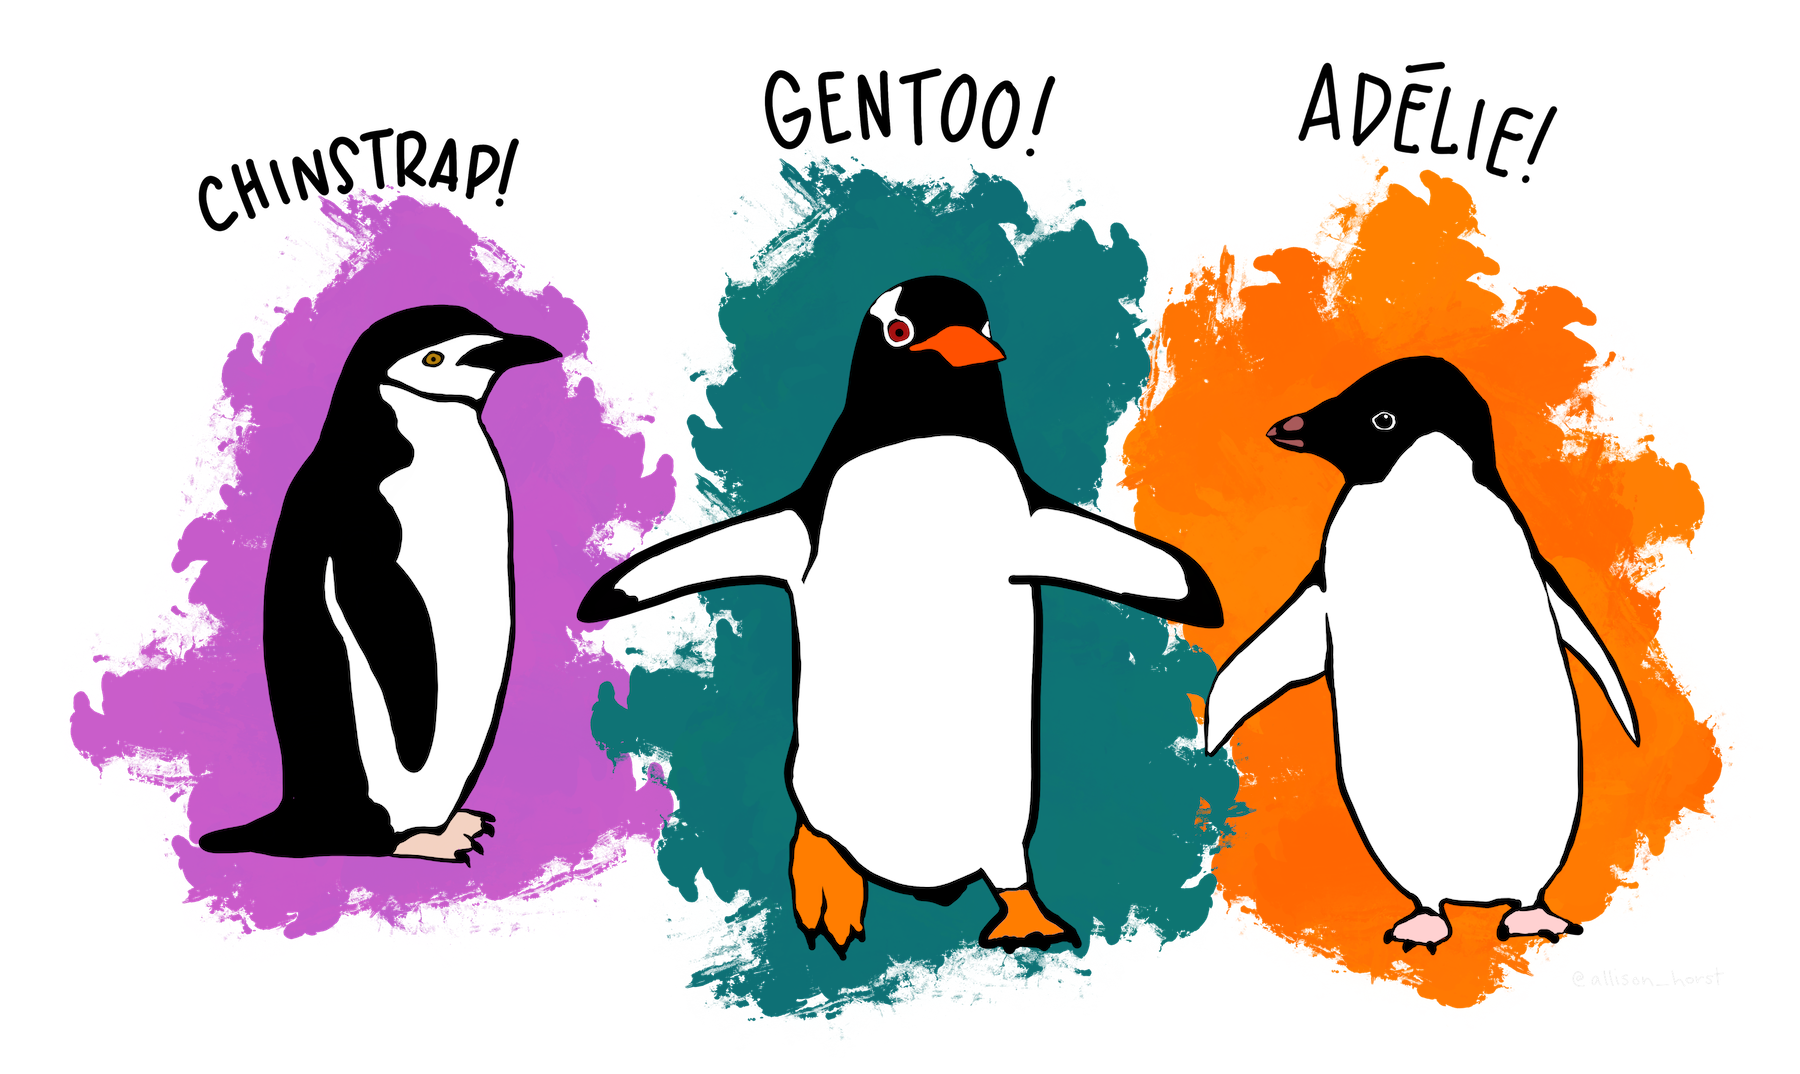
Meet the penguins!
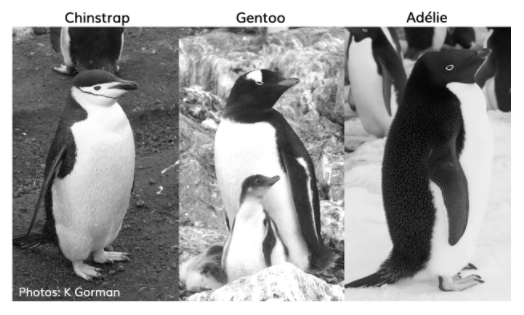
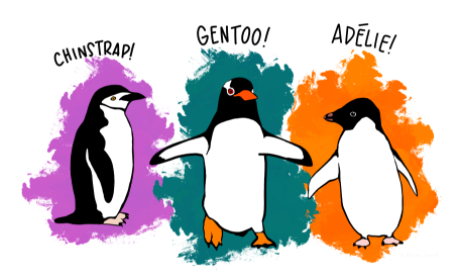
Artwork by @allison_horst
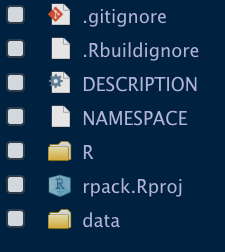
To recapitulate: Setup your R package in a few lines!
usethis::create_package("/path/to/myPackage")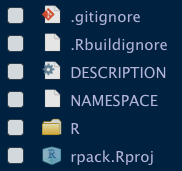
To recapitulate: Setup your R package in a few lines!
usethis::create_package("/path/to/myPackage")
data_fake <- data.frame(First = seq(1:200), Second = rep("A", 200))usethis::use_data(data_fake)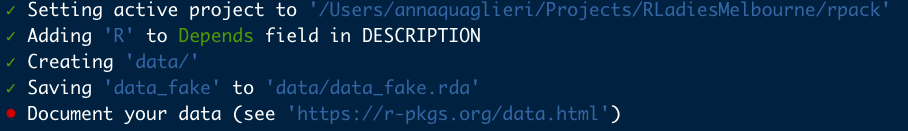
R Packages by Hadley Wickham
{fusen} 📦: Create a package from Rmd
Speaker and author: Sébastien Rochette
If you know how to create a Rmarkdown file, then you know how to build a package.
🔗Introduction to {fusen}
Philosophy You don't need to move around functions and files to create a package, you only need your Rmd with functions, documentation, tests, examples.
install.packages("fusen")library(fusen)
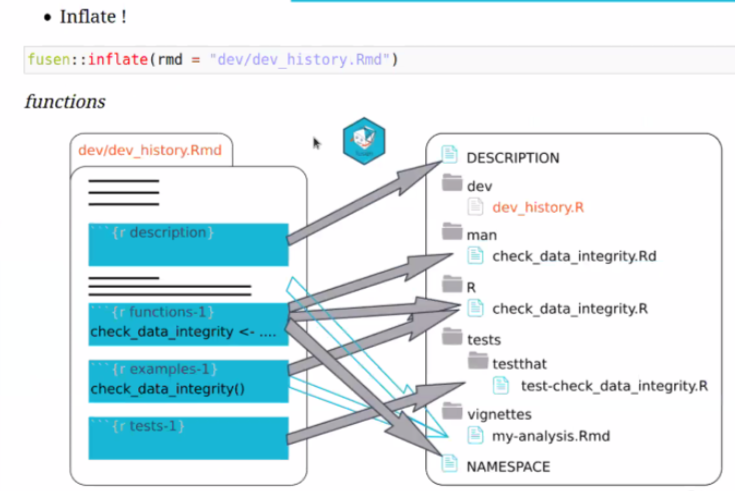
Rmd first approach to write an R 📦
Write your
Rmdusing some prefix to name code chunks, e.g.description,function,tests,examplesThese prefixes will tell
{fusen}how to create your package
Inflate!
Building and maintaining OpenIntro using the R ecosystem
Speaker: Cetinkaya-Rundel, Mine
- 🔗OpenIntro website has loads of resources to teach and learn statistics (for free!)
- 🔗OpenIntro R 📦 has supplemental functions and data for OpenIntro resources.
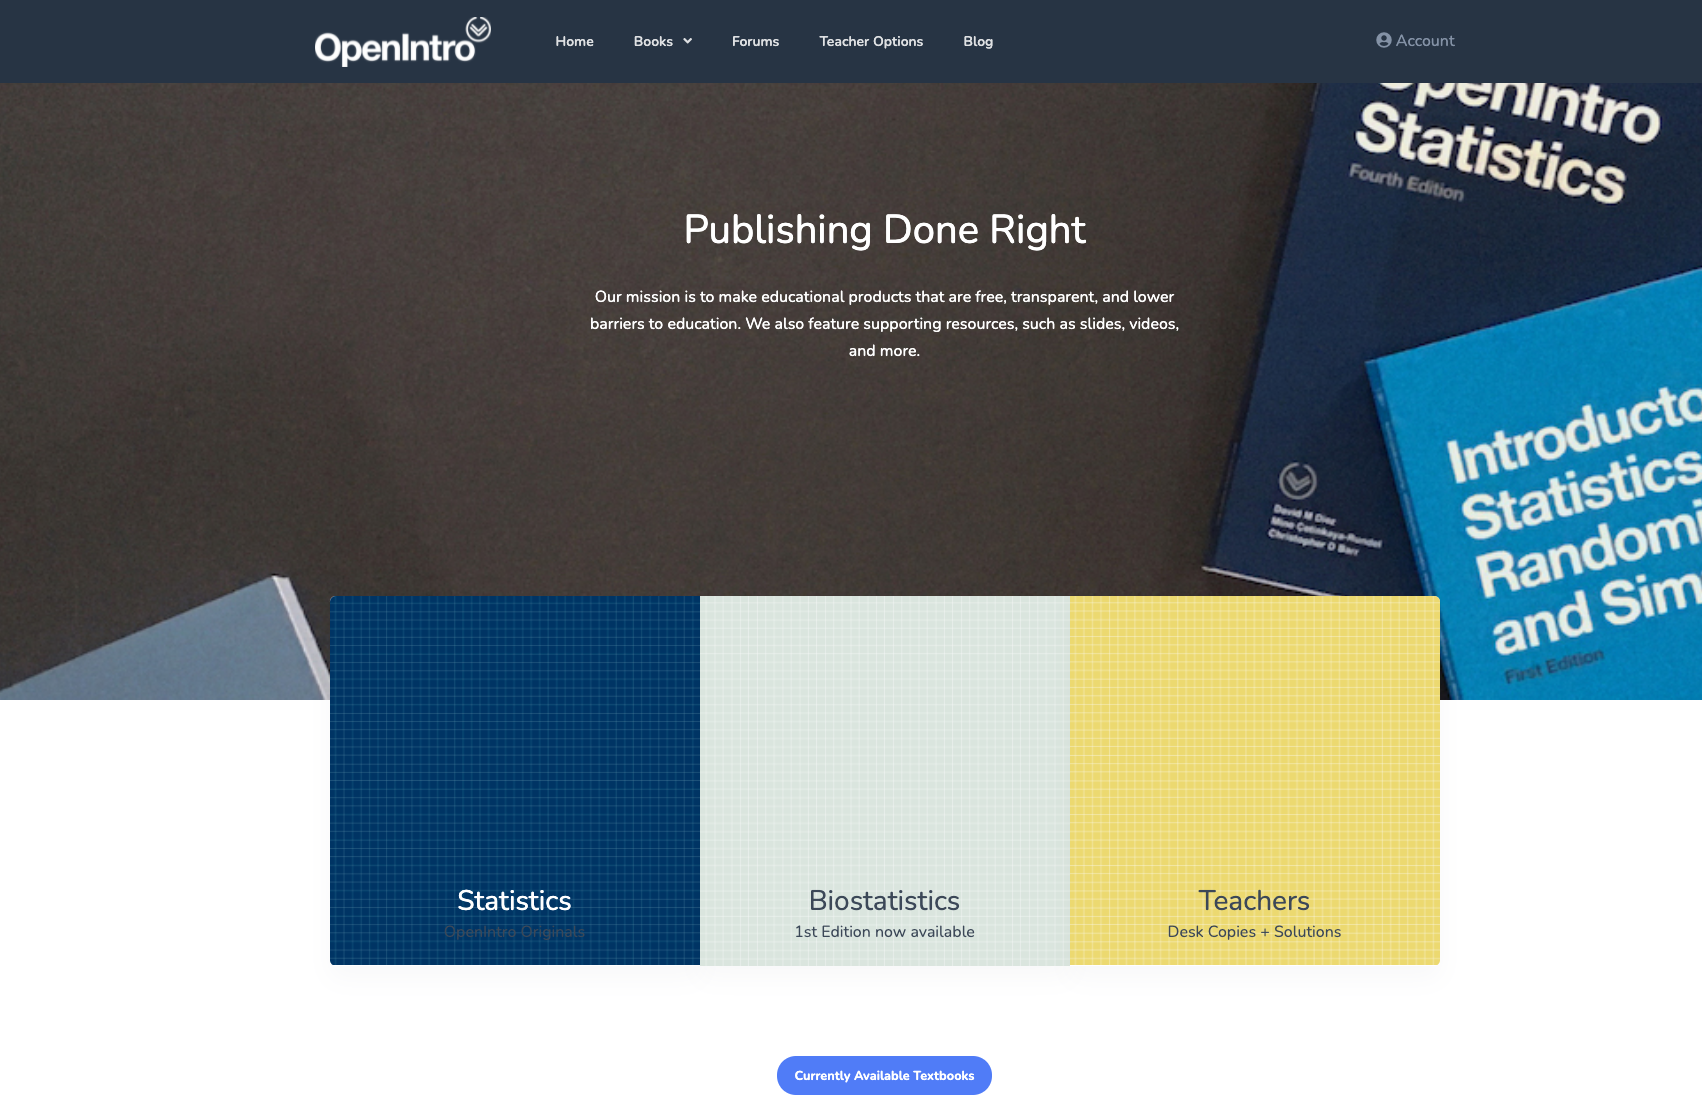
Another lesson to build a data-centric-package!
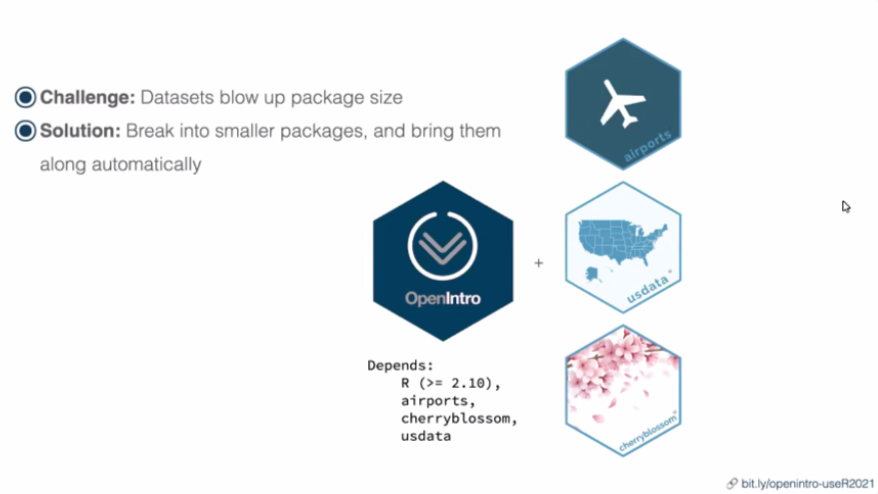
{OpenIntro} depends on 3 other data packages. See package 🔗DESCRIPTION
Teaching and learning Bayesian statistics with {bayesrules} 📦
Speaker: Mine Dogucu (🔗GitHub repo and 🔗Talk slides )
The
{bayesrules}package contains tools for teaching and learning tools for teaching (and learning) Bayesian statisticsThe package accompanies the open-access 🔗Bayes Rules! An Introduction to Bayesian Modeling with R
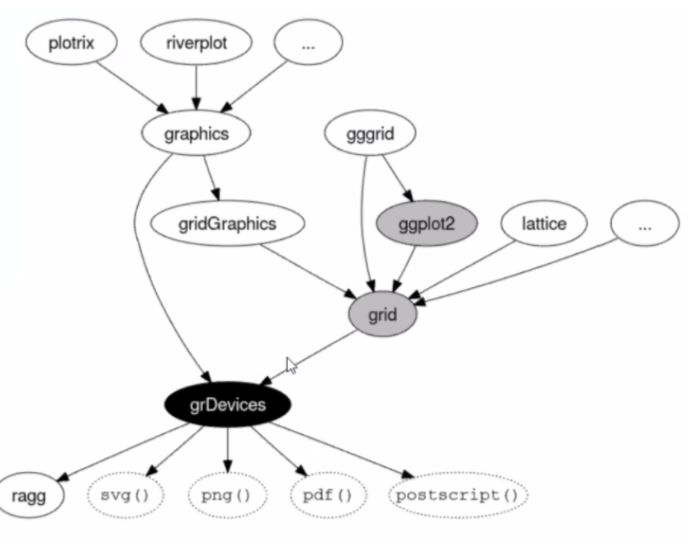
Keynote: Expanding the vocabulary of R graphics
Speaker: Paul Murrel author of {grDevices} 📦
- A graphics engine containing functions for both base and grid graphics.
- The
{grid}📦 is low-level system for plotting within R ({ggplot2}📦 is based on this) - Grid graphics and R’s base graphics are two separate systems.
- Usually worth using grid graphics when you need to create a very unusual plot that cannot be created using
ggplot2
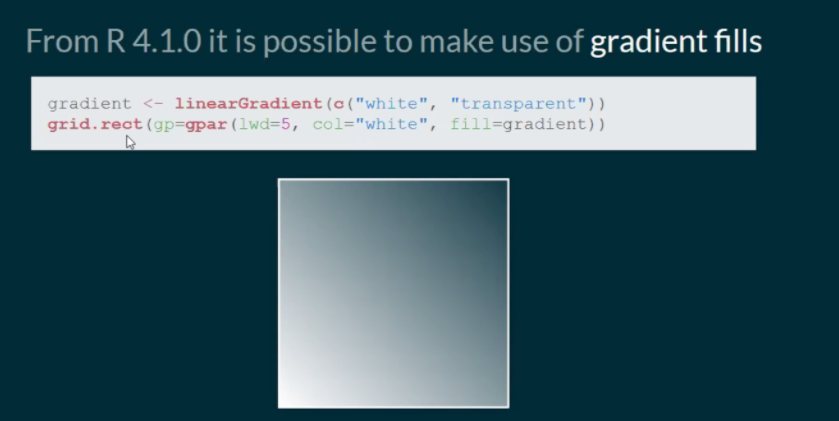
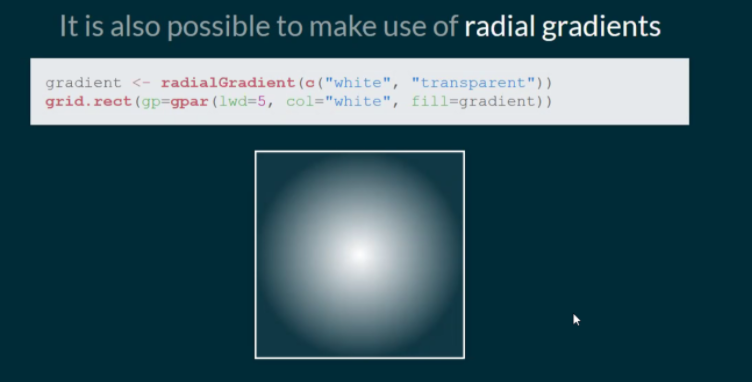
Pattern fills
library(grid)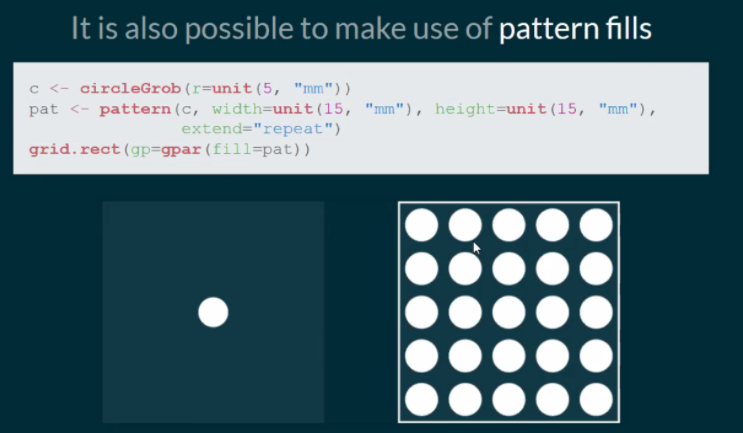
Going beyond statistical plots
🔗Paul Murrel's talk: Going beyond statistical plots
You can build illustrator like viz!
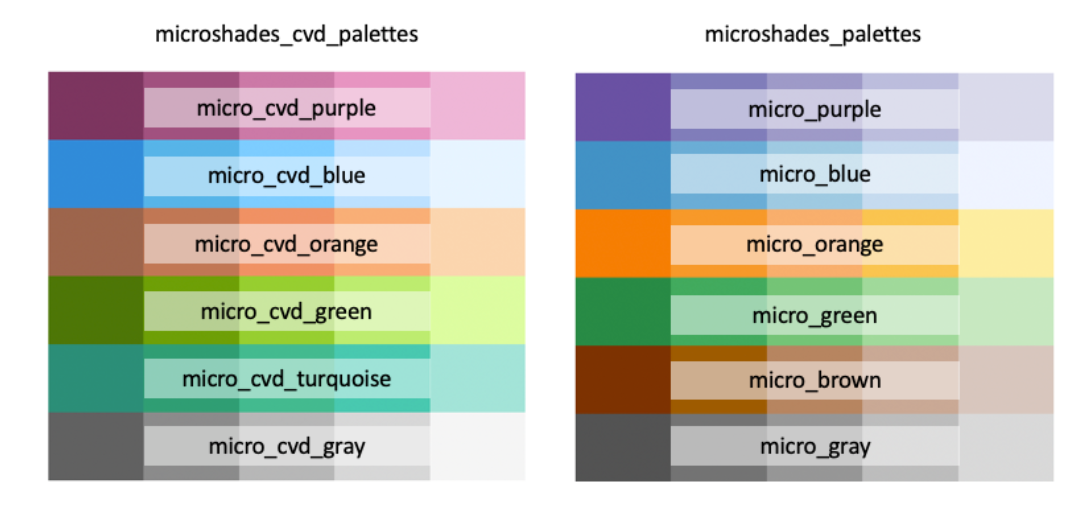
Do you see what I see? The {microshades} 📦
Speaker and Author: Lisa Karstens, PhD
Provide custom color shading palettes that improves:
- accessibility for Color Vision Deficient (CVD) people
- data organization
remotes::install_github("KarstensLab/microshades")Two crafted colour palettes:
microshades_cvd_palettesmicroshades_palettes
Total of 30 available colours per palette.
{microshades} in action!
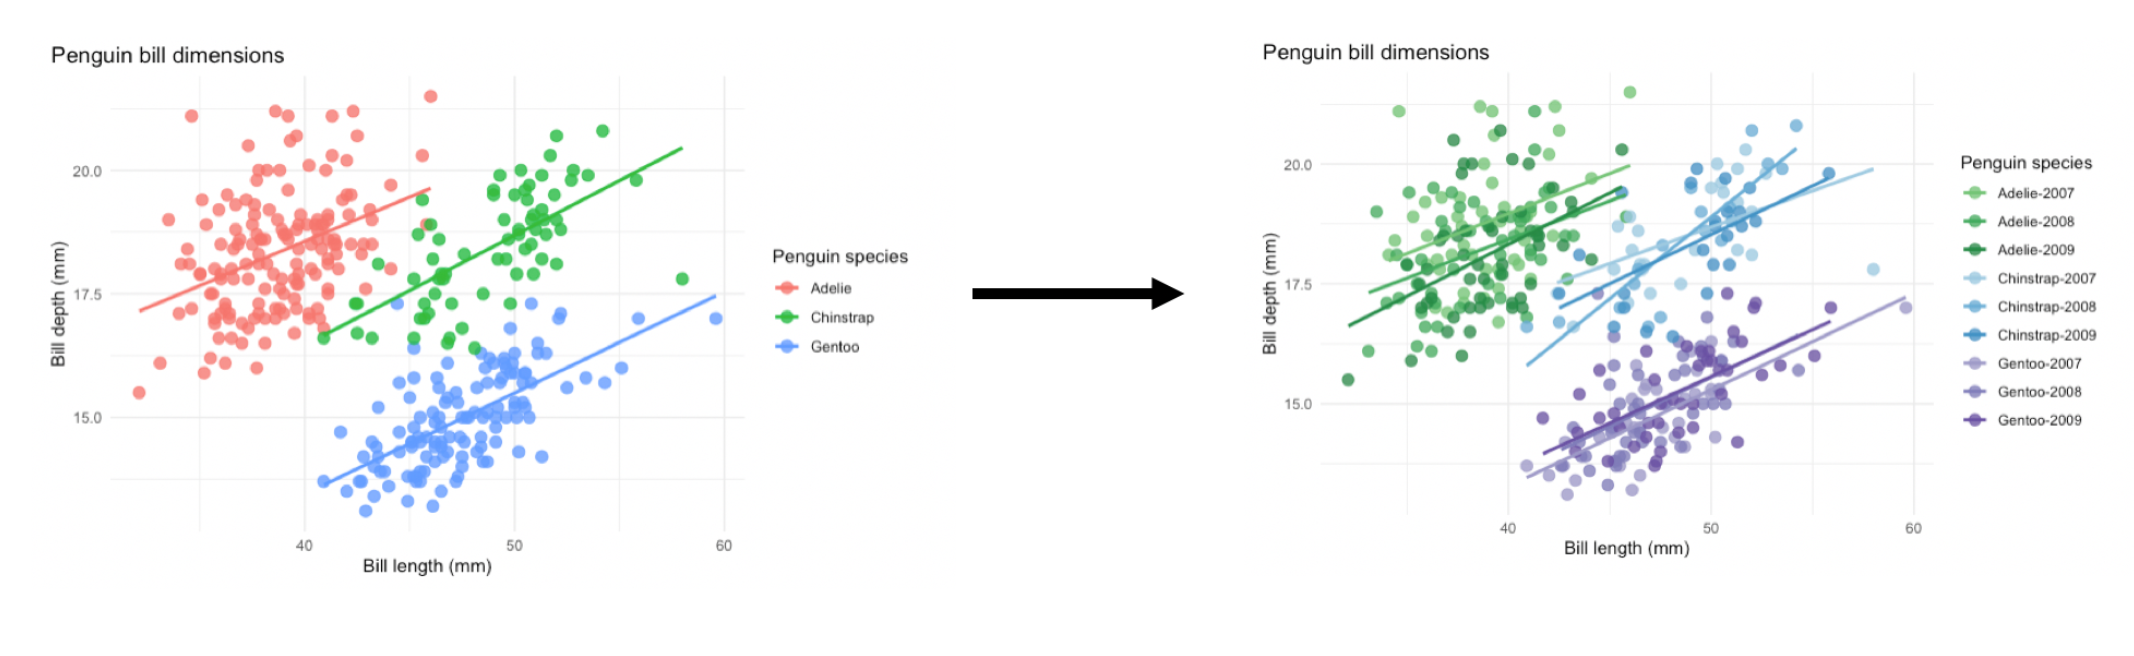
🐧 {palmerpenguins} with {microshades} example code: https://karstenslab.github.io/microshades/articles/non-microbiome_data.html
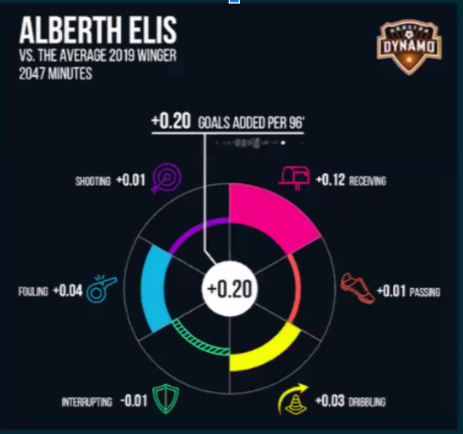
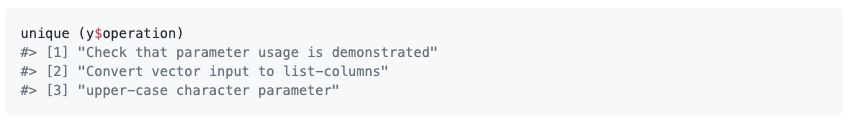
{autotest} in actions
library(autotest)y <- autotest_package(package = "stats", functions = "var", test = TRUE)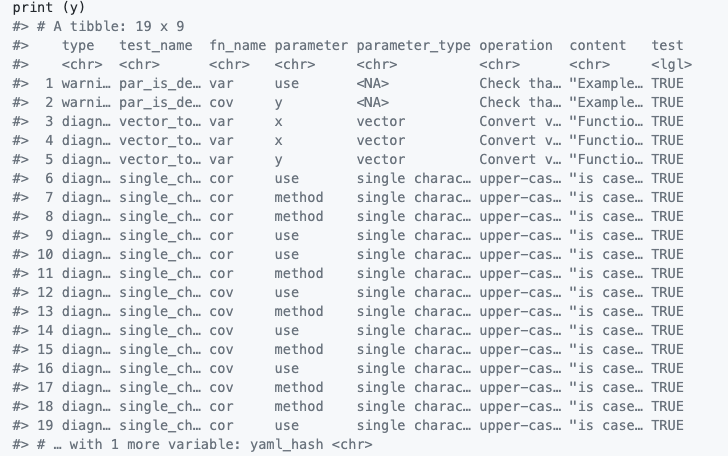
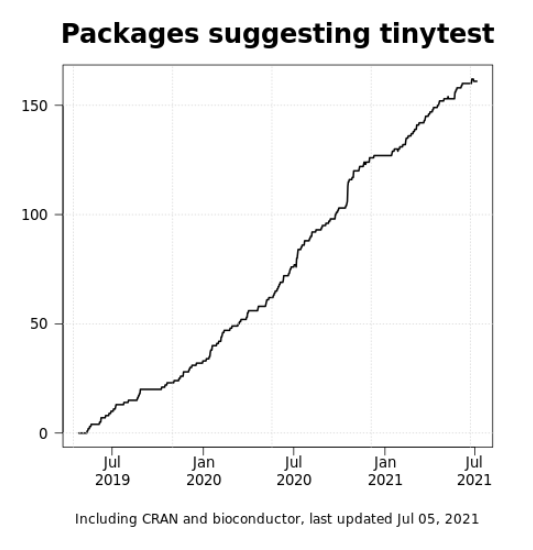
A fresh look at unit testing with {tinytest} 📦
Speaker and author: Mark van der Loo
install.packages("tinytest")The purpose is to facilitate the development of unit testing of R 📦
It provides you with better stats and ideas where the errors actually occurred
[1] M van der Loo (2017). tinytest: R package version 1.2.4. https://cran.r-project.org/package=tinytest
[2] MPJ van der Loo (2020) A method for deriving information from running R code. R-Journal (Accepted) https://arxiv.org/abs/2002.07472
Here is the anomalous-down!
Author and speaker Dr Sevvandi Kandanaarachchi
R packages that Sevvandi developed to find anomalies in high-dimensional data:
Here is the anomalous-down!
Author and speaker Dr Sevvandi Kandanaarachchi
R packages that Sevvandi developed to find anomalies in high-dimensional data:

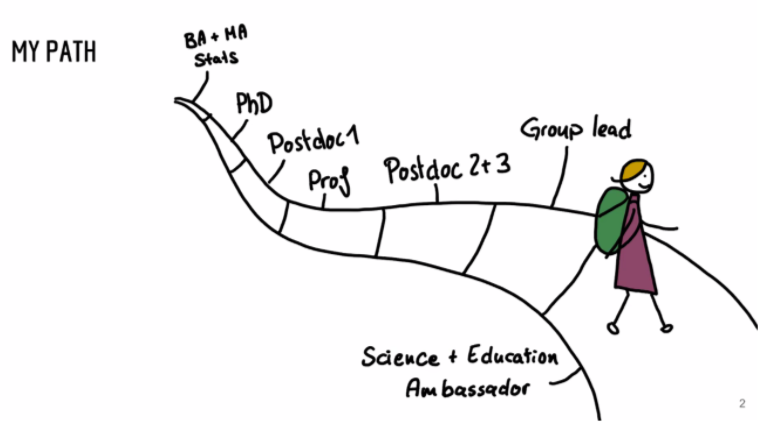
Heidi’s path
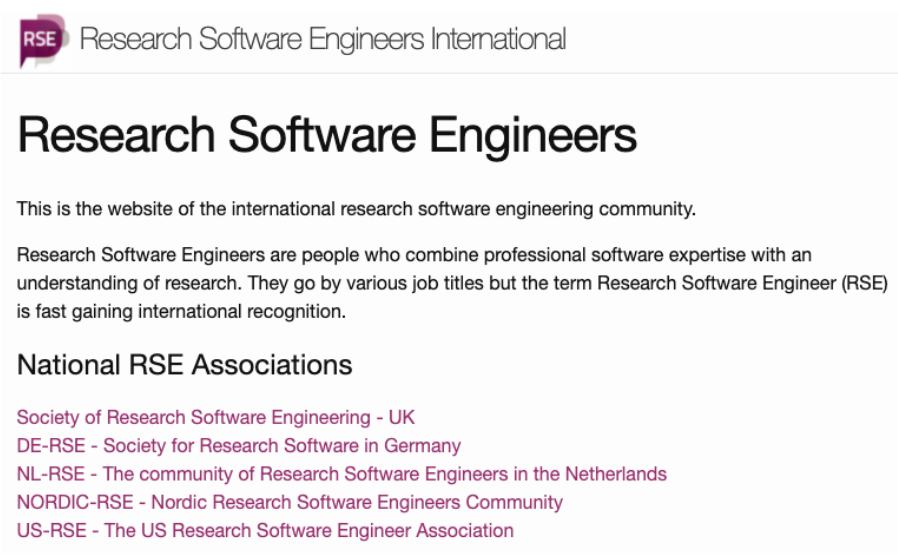
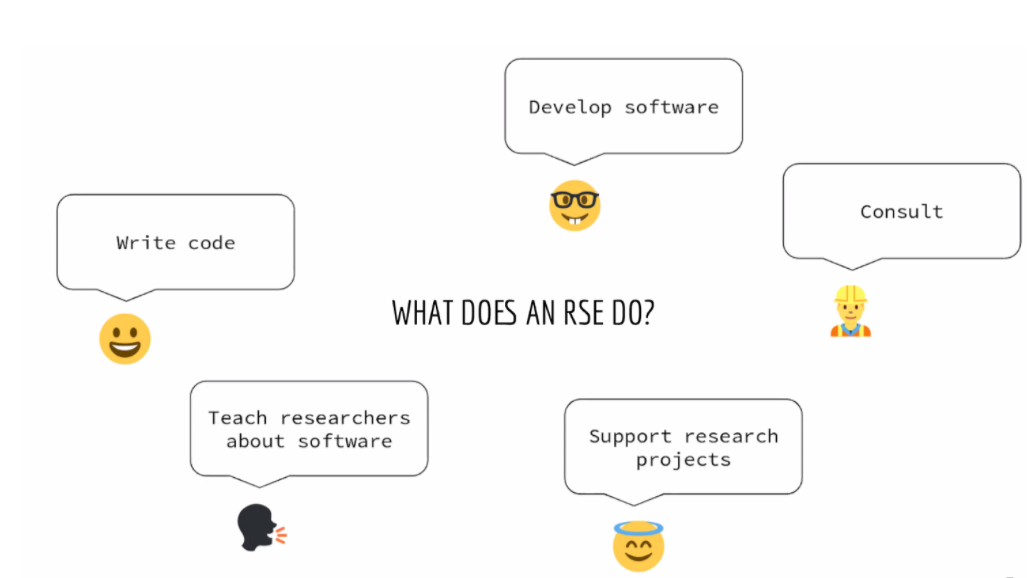
What does an RSE do?
An RSE builds software for research
Generally writes code and teaches about software to researchers
Consult researcher with any kind of software problem
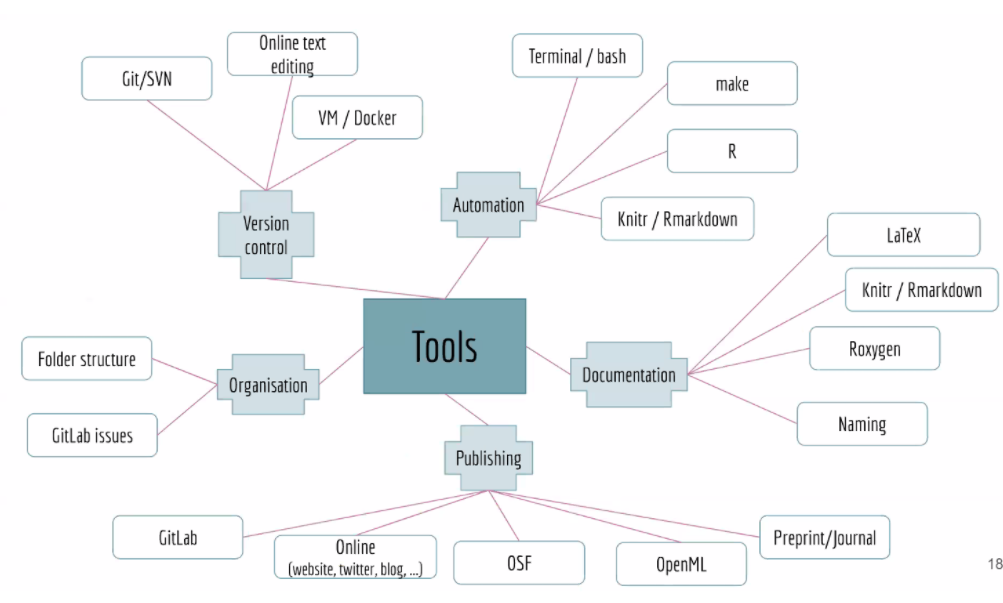
Tools for Open and Reproducible Science
It's a bit too much to expect that the researcher would do all of those things + their research!
The RSE comes to help!
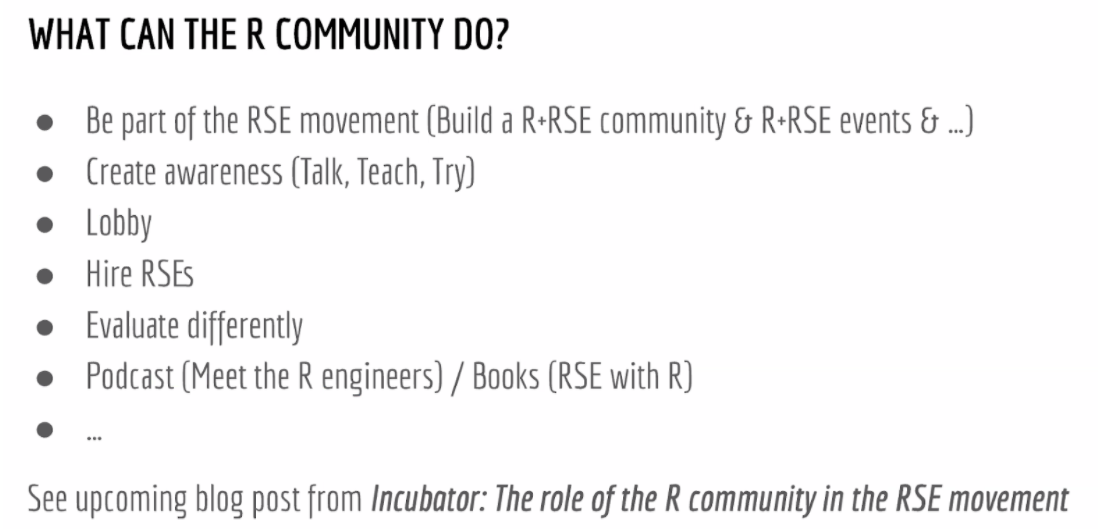
If you think this does for you...
You can become part of the community!
Productionising ML models developed in R
Author: Surya Avala, ML Engineer at @whispr (Talk slides)
(Not from useR!) But I found it really useful!
Phylosphy: Wrapping up everything with Docker 🐳 and using {plumber} 📦 to generate and API for R.
